
Learn analytics
Compare website analytics metrics
Use periods, supporting metrics and reports to make reliable website comparisons.
What it is
Metric comparison is the process of testing a current result against a relevant baseline, then using related metrics and reports to explain the difference. Premely supports previous-period and year-over-year comparisons.
Why use it
Use this method to avoid reacting to an isolated percentage, a mismatched date range or a change that is explained by traffic mix rather than website performance.
Before you start
- Write the question first, such as whether last week's landing-page change improved completed signups.
- Keep the site, reporting timezone, metric definition, goal definition and filter consistent across both periods.
How to use it
- 1
Choose the metric that represents the question
Use visitors for measured audience size, visits for sessions, pageviews for page activity, engagement metrics for session behaviour, and conversion rate or revenue for completed outcomes.
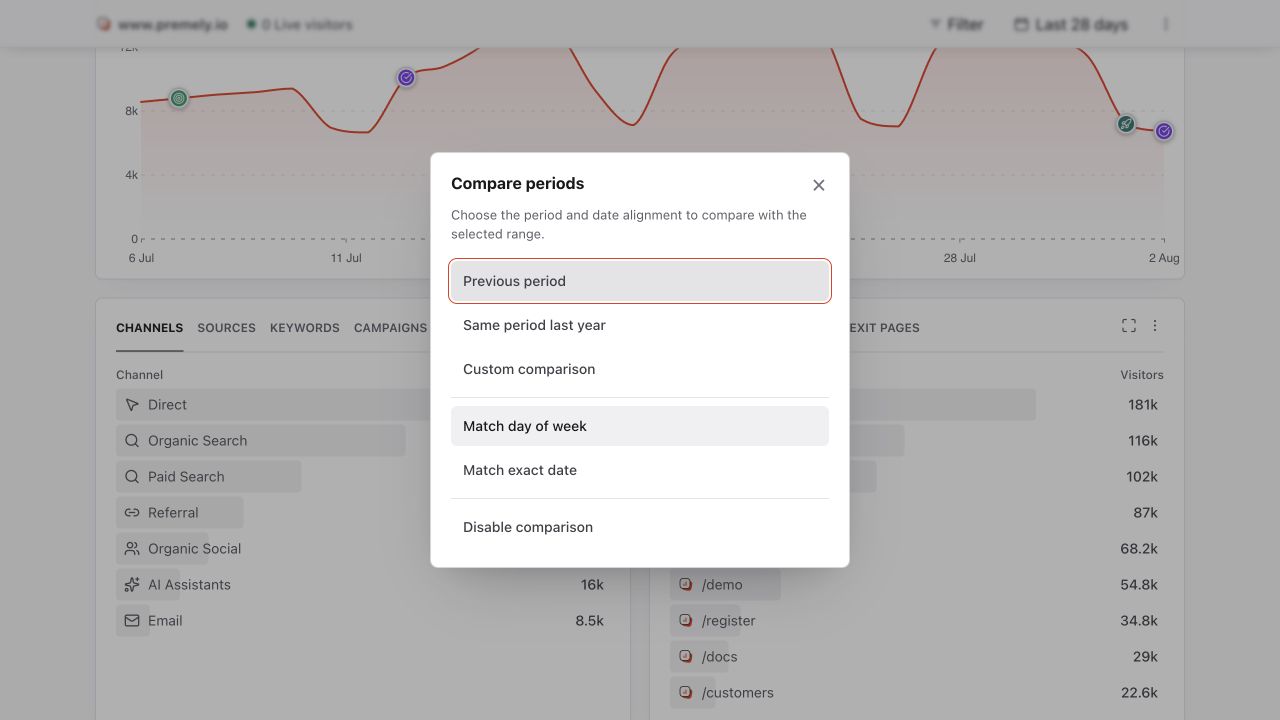
Choose a like-for-like comparison before interpreting the direction or size of a change. Shown in Premely with disposable demo data; your values will differ.
- 2
Choose a fair baseline
Use
Previous periodfor a like-length recent baseline. UseYear over yearwhen annual seasonality is more relevant. Avoid comparing a full period with one that is still in progress unless that is intentional. - 3
Read the absolute value before the percentage
A large percentage change from a very small baseline can represent only a few visits or conversions. Read the current count, comparison count and direction together.
- 4
Pair volume with quality
Compare visitors with conversions, visits with engagement, and pageviews with page-level outcomes. For example, more traffic with a lower conversion rate can still produce more total conversions, so review both rate and count.
- 5
Use a report to explain the difference
Check whether the change is concentrated in a source, page, country, device or event. Apply one purposeful analytics filter when you need to test that explanation.
- 6
Record a decision, not just an observation
Finish with the change you will make, the metric you expect it to affect and the period you will review next. This keeps analysis connected to an outcome.
What to expect
Correlation does not prove the cause
A source, page or release can align with a metric change without causing it. Use the narrowest relevant report and repeat the comparison before making a high-impact decision.
Rates need their denominator
Read conversion rate with visitors and bounce rate with visits. A rate without the population behind it can exaggerate small changes.
Useful ways to apply this
Compare a landing-page test
Keep the traffic source and goal definition stable, then compare visitors, unique conversions and conversion rate across equal periods.
Explain a traffic spike
Compare visitors and visits first, then open Sources and Top Pages to find where the increase was concentrated and whether conversions moved with it.