
Learn analytics
Understand Premely's revenue-first analytics
What revenue-first means in Premely: understand traffic, acquisition, behaviour and conversions alongside verified revenue, with clear measurement boundaries.
What it is
Premely is a revenue-first, privacy-first analytics platform for understanding traffic, acquisition, behaviour, conversions and verified revenue together. Revenue-first describes how the platform puts business outcomes in context, not a restriction to revenue reports.
Why use it
Use this overview to understand the role of each report before you compare results or make a website change.
Before you start
- Confirm the selected site, reporting timezone and date range. Every metric and report on the dashboard uses that context.
- Treat analytics as evidence about measured activity, not as a profile of an identified person. Premely uses privacy-safe identifiers and excludes traffic classified as a known bot.
How to use it
- 1
Start with traffic volume
Read
Unique visitors,Total visitsandTotal pageviewstogether. They tell you how many distinct visitors were measured, how many sessions they started and how many pages those sessions produced.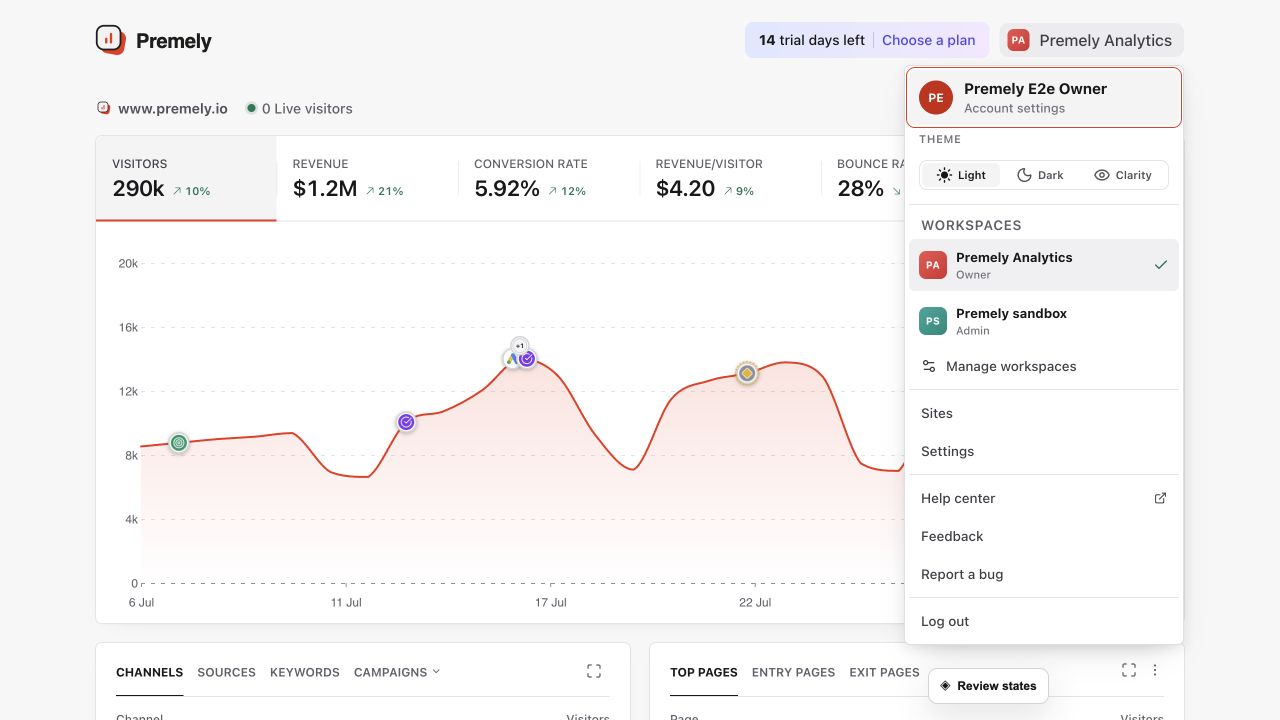
Read from the selected period and headline metrics down to the report that answers your question. Shown in Premely with disposable demo data; your values will differ.
- 2
Add engagement context
Use
Views per visit,Bounce rateandVisit durationto understand how sessions developed. These metrics describe different parts of a visit, so no single one is a universal quality score.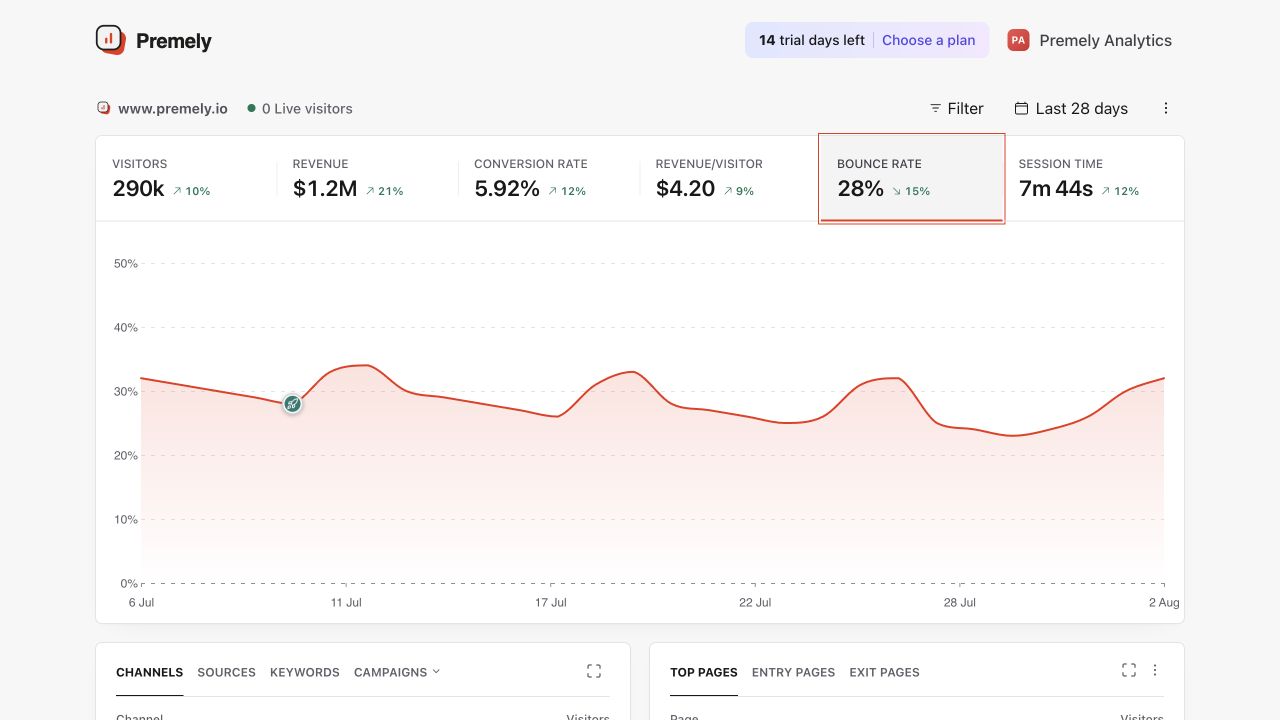
Choose one engagement metric at a time and read it in the context of the selected reporting period. Shown in Premely with disposable demo data; your values will differ.
- 3
Find the report that explains the change
Use traffic sources to understand acquisition, Top Pages to understand content activity, and Countries, Devices, Conversions or Properties when that context is relevant to the question.
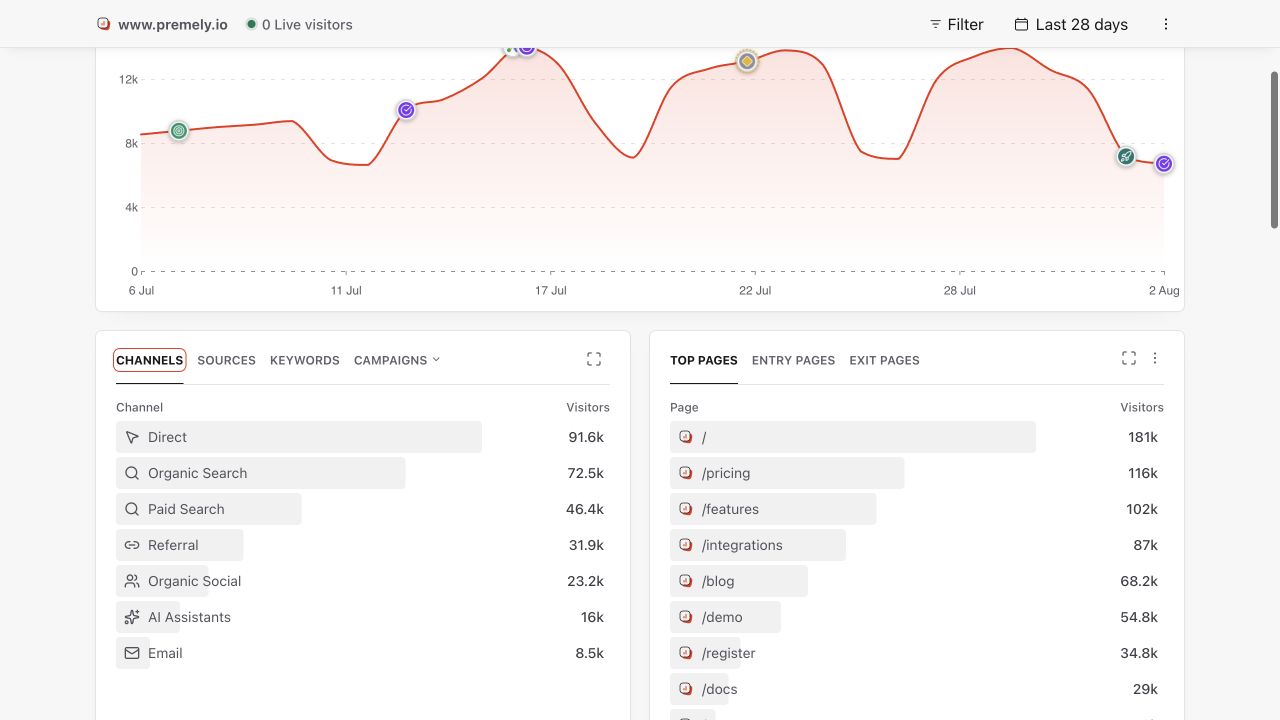
Open the acquisition detail to compare the channels and sources that brought measured visitors. Shown in Premely with disposable demo data; your values will differ.
- 4
Connect activity to an outcome
Use conversion goals for completed actions and funnels for two ordered goals. When revenue is connected, read it by currency and keep unattributed revenue visible.
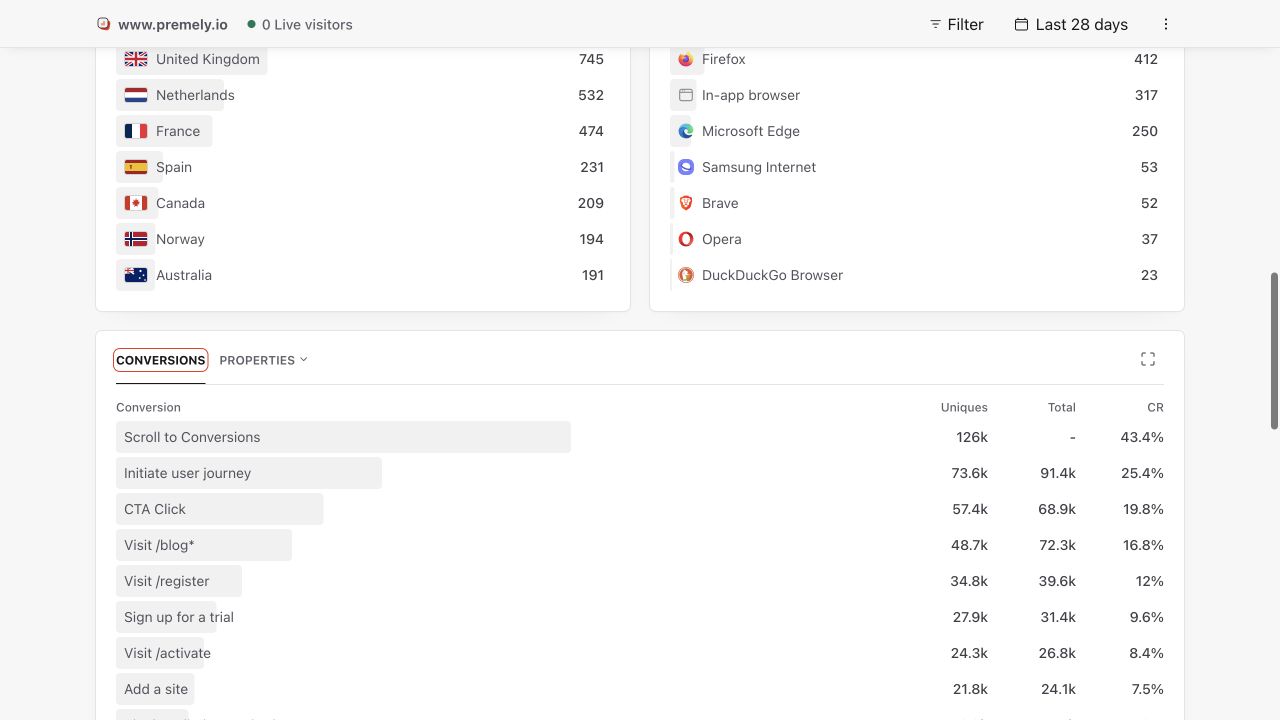
Use the dashboard conversion report to verify results after creating or changing a goal. Shown in Premely with disposable demo data; your values will differ.
- 5
Compare before you conclude
Check the same metric across a suitable comparison period, then use a supporting report to explain the direction of change. Compare website analytics metrics gives you a repeatable method.
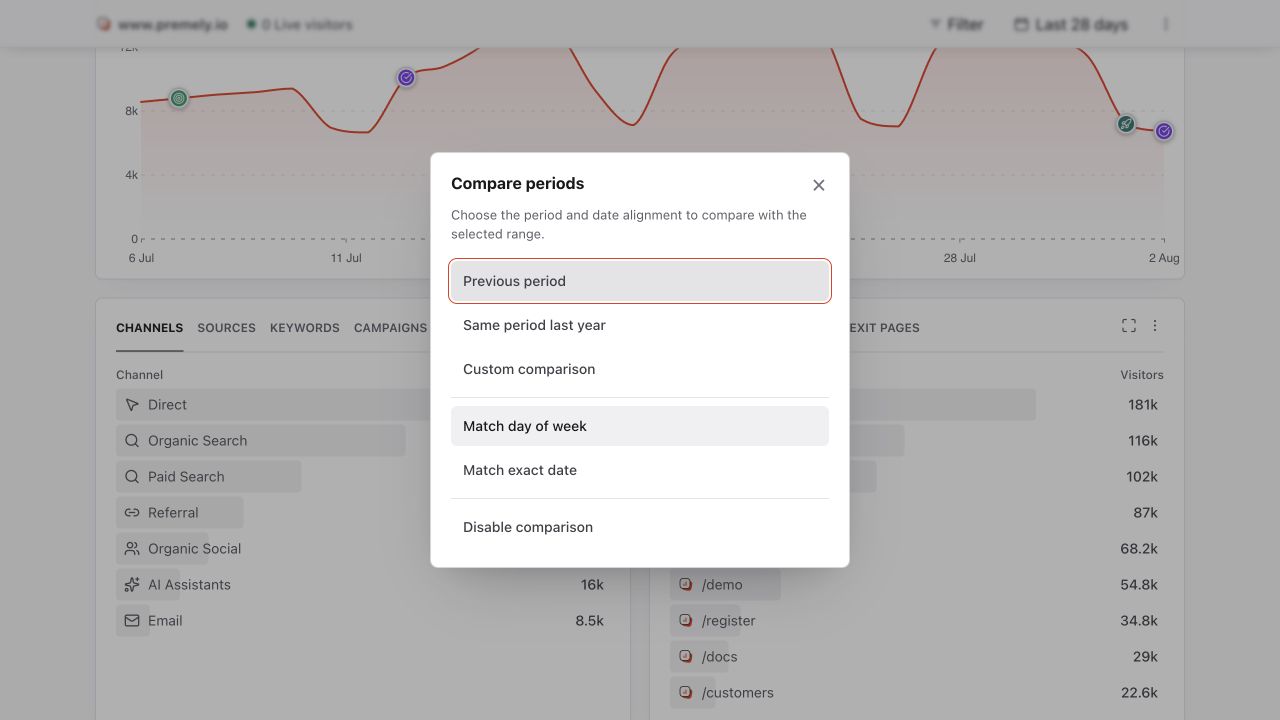
Choose a like-for-like comparison before interpreting the direction or size of a change. Shown in Premely with disposable demo data; your values will differ.
What does revenue-first mean?
Revenue-first means asking what creates business value, not only how much traffic a website receives. In Premely, acquisition, visitor behaviour, goals and funnels help explain the activity around commercial outcomes. Supported revenue connections add verified payment records. Revenue-first is the organising principle of the platform, not a claim that it only analyses revenue.
- Payments require a supported, active connection or server-side ingestion. Attribution requires verified linkage, and unmatched revenue remains unattributed. Website activity does not automatically identify a customer or establish repeat-customer value.
- Read traffic sources, goals, funnels and revenue metrics together. These reports describe different measured signals; they do not prove that every source or campaign caused a payment.
- Premely is not limited to Framer or modern JavaScript frameworks. Choose a supported installation method, including the official WordPress and WooCommerce plugin, a site-builder integration, the HTML snippet or the JavaScript SDK.
What to expect
A number needs a question
A higher value is not automatically better. More pageviews can reflect stronger interest, repeated navigation or difficulty finding information. Use the related metrics and reports to distinguish between them.
Measurement states stay explicit
Premely distinguishes setup, waiting, missing and zero-value states. It does not turn unavailable visit duration into a measured zero or silently combine currencies.
Useful ways to apply this
A weekly website review
Review traffic first, engagement second and conversions third, then record the page or source that most clearly explains the change.
A campaign review
Start with the campaign period and acquisition source, then follow the landing activity through to the matching goal or revenue result.