Conversions
How to Track Your SaaS Funnel From Visitor to Paying Customer
Measure the whole lifecycle, find the meaningful drop-offs, and model what an improvement could be worth without mistaking a scenario for a forecast.

Premely team
On this page
A signup is a milestone, not the finish line
Campaign A turns 10% of visitors into trials, then 5% of those trials into paying customers. Campaign B turns 6% into trials, then 35% into customers. Looking only at trial conversion, A wins. Looking at visitor-to-paid conversion, B reaches 2.1% against A’s 0.5%.
| Campaign | Trial rate | Trials | Trial to paid | Expected paid |
|---|---|---|---|---|
| A | 10% | 100 | 5% | 5 |
| B | 6% | 60 | 35% | 21 |
With equal first-payment values, B produces 4.2 times as many paying customers for the same number of visitors. Whether it is the better investment still depends on acquisition cost, refunds and retention. The point is that optimising an isolated signup rate can reward the wrong traffic.
- 01Visitor
- 02Landing page
- 03Signup
- 04Activation
- 05Trial
- 06Checkout
- 07Paid
- 08Repeat payment or subscription
- 09Revenue
This is a conceptual lifecycle. Your product may place trial before activation or allow direct purchase; measure the path you actually operate.
Premely’s conversion journey context is useful for investigating short acquisition paths. Keep the distinction between those bounded anonymous paths and a longer-lived account lifecycle. A multi-week trial should not be squeezed into a same-day anonymous funnel and treated as complete.
Define the cohort and the unit before calculating rates
A sequential funnel measures the same group progressing through ordered steps within a defined window. “This month’s visitors” divided into “this month’s payments” is not automatically that funnel: many paying customers may have arrived in an earlier month.
Choose one unit
For a self-serve individual product, the unit might be a person. For a team product, it might be a workspace. Decide how an anonymous visitor becomes that unit and what happens when several users belong to one account. Do not mix account-level payments with person-level activation without explaining the mapping.
Define activation as received value
“Opened the dashboard” is easy to record but may not indicate value. A useful activation event could be a first successful report, a completed setup or a published project. Choose the event because it represents the product promise, then verify whether it predicts later customer value.
Give the cohort time
Use an observation window that matches the trial and sales cycle. Mark immature cohorts rather than calling their uncompleted trials failures. Keep the window stable when comparing channels, or one channel may appear worse simply because its visitors arrived later.
Model an improvement at one step
SaaS funnel calculator
Enter five counts to see where people drop off. Use the same cohort, moving through each step in order. The example is illustrative, not a benchmark.
Largest drop-off: Signups. A place to investigate, not proof of a defect.
Explore improvement and revenue scenariosOptional payment values and a 5%, 10% or 20% relative improvement
A 10% relative improvement changes a 20% rate to 22%, not 30%. Each scenario changes one step only, with every other rate and payment value held fixed.
- First revenue / visitor
- £0.49
- First-payment revenue
- £4,900.00
| Step reached | Step rate | People lost | New step rate | Extra paid | Extra first revenue | Extra cohort MRR |
|---|---|---|---|---|---|---|
| Signups | 10.00% | 9,000 | 11.00% | 10 | £490.00 | £390.00 |
| Activated users | 60.00% | 400 | 66.00% | 10 | £490.00 | £390.00 |
| Trials | 66.67% | 200 | 73.33% | 10 | £490.00 | £390.00 |
| Paid customers | 25.00% | 300 | 27.50% | 10 | £490.00 | £390.00 |
Rates are capped at 100%. A zero-conversion step cannot be projected by a relative uplift and stays n/a. Fractional customers are expected values, not promised sales. MRR is a cohort estimate, not lifetime value; churn, refunds, costs and time to conversion are not modelled.
Save or share your result
Nothing is sent by this tool unless you choose to copy, save or share. A share link includes your inputs. Anyone with the link can read them.
In the starting example, 10,000 visitors produce 100 paying customers: a 1% visitor-to-paid rate. At a £49 average first payment, first-payment revenue is £4,900 and revenue per visitor is £0.49. These are illustrative inputs, not a SaaS benchmark.
A 10% relative improvement to a 10% step rate makes it 11%, not 20%. The calculator changes one step at a time, caps it at 100% and keeps downstream conversion rates fixed. That makes the arithmetic inspectable without implying that behaviour will stay unchanged in a real experiment.
new step rate = min(100%, current step rate × 1.10)
projected paid = current paid × new rate / current rate
extra first revenue = extra paid × average first payment
extra cohort MRR = extra paid × monthly ARPU
If a current step rate is zero, a relative uplift cannot establish a viable new rate. The tool shows “n/a” for that projection. Fix the measurement or use a separately justified absolute-rate scenario; do not turn zero evidence into a growth forecast.
The biggest drop-off is a starting point, not a verdict
Most visitors will not sign up. That can make the first stage the largest absolute drop-off even when nothing is broken. The useful question is which change is both achievable and valuable. A small improvement near payment may be easier to deliver than a broad increase in low-intent signups.
In a simple multiplicative funnel, the same relative improvement at different uncapped steps can produce the same projected paid increase. That is expected mathematics, not a calculator bug. Real decisions differ because the cost, difficulty and customer-quality effects of those improvements are not equal.
| Stage | Possible investigation | Quality check |
|---|---|---|
| Visitor to signup | Landing-page promise, source intent, confusing form | Do the extra signups activate? |
| Signup to activation | Time to first value, setup failure, missing data | Is activation a genuine value event? |
| Trial to paid | Plan fit, limits, checkout failure, unclear value | Do new customers stay and avoid refunds? |
| Paid to renewal | Ongoing value and subscription health | Use a longer-lived customer/cohort model. |
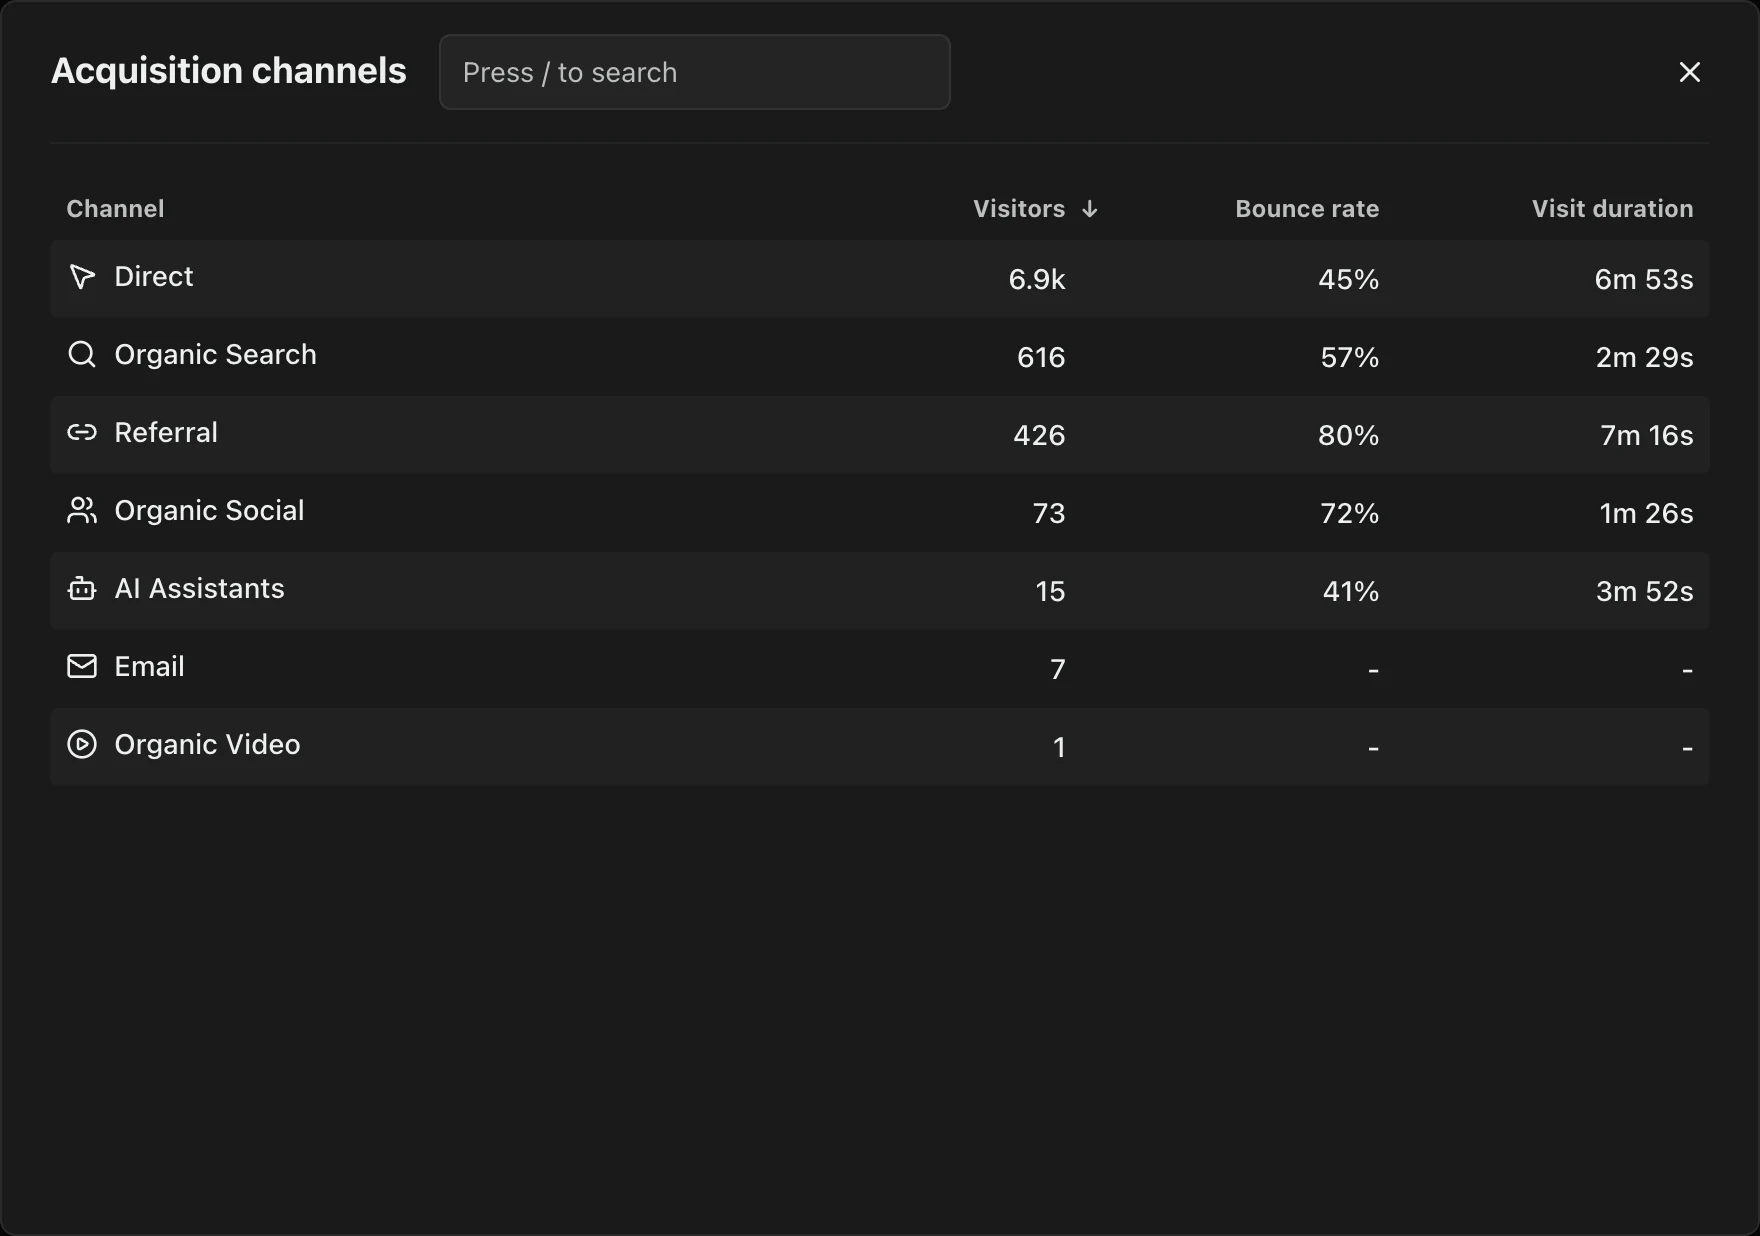
Segment carefully. Device, source and landing page can help locate a problem, but tiny slices create noisy stories. Look for a repeatable pattern and supporting evidence before deciding that a specific group needs a different experience.
Turn the insight into one piece of work
- Validate the event definition and stage order.
- Choose one mature cohort with enough outcomes to examine.
- Identify the friction behind the suspected drop-off.
- Write a hypothesis and a measurable change.
- Review downstream paid conversion, refunds and retention as guardrails.
- Compare the result using the original definitions and window.
Keep the scenario and the observed result side by side. An expected 10% improvement is an assumption; a measured improvement needs an appropriate comparison and enough time. The calculator’s MRR figure is only a cohort estimate from paid customers and ARPU. It does not model churn, expansion, costs or lifetime value.